RAG Status Indicators in Jira: Best Practices for Project Health
Project status reports tend to lag behind reality, obscure problems, or paint too rosy a picture. Red/Amber/Green (RAG) status indicators solve this when implemented correctly. Your team replaces ambiguous text updates with a shared visual language that everyone from developers to executives can interpret in seconds. A PMI Pulse of the Profession report found that 44% of underperforming projects cite poor status communication as a contributing factor, exactly the problem RAG systems address.
Getting RAG right requires more than picking three colors. You need clear definitions, consistent update cadences, honest reporting culture, and tooling that removes friction.
What Are RAG Status Indicators?
RAG status indicators are a Red/Amber/Green color-coded system used in project management to communicate project health at a glance. Borrowed from traffic lights, the system maps naturally to how people already think about risk: green means go, amber means caution, red means stop and address the problem.
RAG works because it is simple. You can scan a portfolio of 50 projects in seconds. A red item draws your eye immediately. Amber signals "watch this" without triggering panic. Green confirms "no action needed here."
RAG is widely used in IT project management, software delivery, construction, government programs, and any domain where multiple workstreams need oversight from leadership that does not have time to read detailed reports. The methodology is recommended by frameworks including PRINCE2 and the PMBOK Guide as a standard tool for project status communication.
RAG Summary Table
| Color | Meaning | Typical Threshold | Recommended Action |
|---|---|---|---|
| Green | On track | Within 5% of planned timeline and budget | Continue as planned; no intervention needed |
| Amber | At risk | 5-15% schedule or budget variance; blockers with mitigations | Monitor closely; escalate if no improvement within one cycle |
| Red | Off track | >15% variance; critical blockers without resolution | Immediate leadership attention; reallocate resources or adjust scope |
Defining Your RAG Criteria
The single most important step in any RAG implementation is writing down what each color means for your organization. Without shared definitions, "green" means "I think we're fine" to one team lead and "we will hit the exact date I committed to" to another. This inconsistency makes portfolio-level reporting unreliable.
Green: On Track
- Delivery is on schedule (within 5% of planned timeline)
- No blocking issues
- Resource allocation is stable
- Stakeholder expectations are aligned
- Dependencies are resolved or on track (managing dependencies in Jira is a prerequisite for accurate RAG reporting)
Amber: At Risk
- Timeline slippage of 5-15%
- Blocking issues exist but have mitigation plans
- Resource constraints emerging
- Scope changes under discussion
- Approval workflows are stalled or pending, a common but overlooked cause of amber status
Red: Off Track
- Timeline slippage exceeding 15%
- Critical blocking issues without clear resolution
- Key resources unavailable
- Major scope or requirements changes
What Makes a Good RAG System
The best RAG implementations share these qualities:
- Clear definitions. Everyone agrees on what red, amber, and green mean.
- Consistent updates. Your team refreshes status regularly, not only before reviews.
- Actionable responses. A red status triggers a specific response with an owner and a deadline.
When any of these qualities is missing, RAG becomes theater. Teams check a box, managers glance at a dashboard, and nobody changes behavior based on what they see.
Common Mistakes
Too many colors
Stick to three. Some organizations add blue for "complete," grey for "not started," or purple for "blocked." Every additional color dilutes the system's simplicity. If you need to track completion status, use a separate field.
Status inflation
Everything is green until it is suddenly red, with amber skipped entirely. Status inflation happens when teams view amber as an admission of failure rather than a proactive risk signal.
Fixing this requires a culture change. Leadership must reward early amber reporting. When a team flags amber and resolves the issue before it turns red, celebrate that. One global technology company we worked with found that only ~30% of their teams used consistent RAG definitions before standardizing, and status inflation was rampant. After rolling out shared definitions and tooling, honest reporting increased across all 40+ teams because amber stopped being seen as failure.
Update lag
Stale status is worse than no status. If your dashboard shows green but the project went off track three days ago, the dashboard is actively harmful: it creates false confidence. Define a maximum staleness threshold and flag or auto-expire statuses that exceed it.
No escalation path
A red status without a defined response is just a decoration. Before you launch RAG reporting, document what happens when something goes red. Who gets notified? What meeting gets scheduled? What authority does the project manager have to pull in additional resources? Without answers to these questions, red becomes background noise.
Inconsistent granularity
RAG at the epic level and RAG at the portfolio level need different rules. A single blocked story should not turn an entire program red. Define aggregation logic: for example, a project is amber if more than 20% of its epics are amber, and red if any epic has been red for more than one sprint.
RAG Reporting Cadence
How often you update RAG status depends on the level:
- Issue/story level: Updated as part of daily standups or when status changes. This is lightweight: a field update, not a report.
- Epic/project level: Updated weekly, typically as part of sprint review or a dedicated 15-minute status sync. Weekly is the minimum cadence for meaningful trend analysis.
- Portfolio level: Reviewed weekly by leadership. The data should be real-time (aggregated from project-level updates), even if the review meeting is weekly.
- Red items: Updated daily. Any item at red status should have a brief daily check-in until it returns to amber or green.
A common mistake is treating all levels the same. Requiring daily portfolio-level updates creates noise. Allowing monthly project-level updates creates blind spots.
Why Jira Does Not Include RAG Natively
Jira is built around workflows, issue types, and fields, but it does not ship with visual RAG status indicators. Teams that want RAG reporting in Jira without dedicated tooling typically cobble together a workaround:
- Custom single-select fields with options named "Green," "Amber," and "Red." These work for data entry but have no color coding in views, boards, or dashboards. A wall of text labels defeats the purpose of at-a-glance visibility.
- Priority field abuse. Repurposing the priority field for RAG status breaks priority-based workflows, JQL queries, and SLA tracking.
- Manual spreadsheet exports. Exporting Jira data to Excel or Google Sheets, color-coding cells manually, and sharing via email or Confluence. This is the most common approach in large organizations, and the most painful. Data is stale the moment it is exported.
- No aggregation. Even with custom fields, Jira has no built-in way to roll up RAG status from stories to epics to projects to portfolio. Each level must be updated manually and independently.
- No dashboard gadgets. Jira's native dashboard gadgets do not support color-coded RAG displays. You can build a filter-based gadget showing issue counts, but you cannot build the kind of visual health overview that executives want to see.
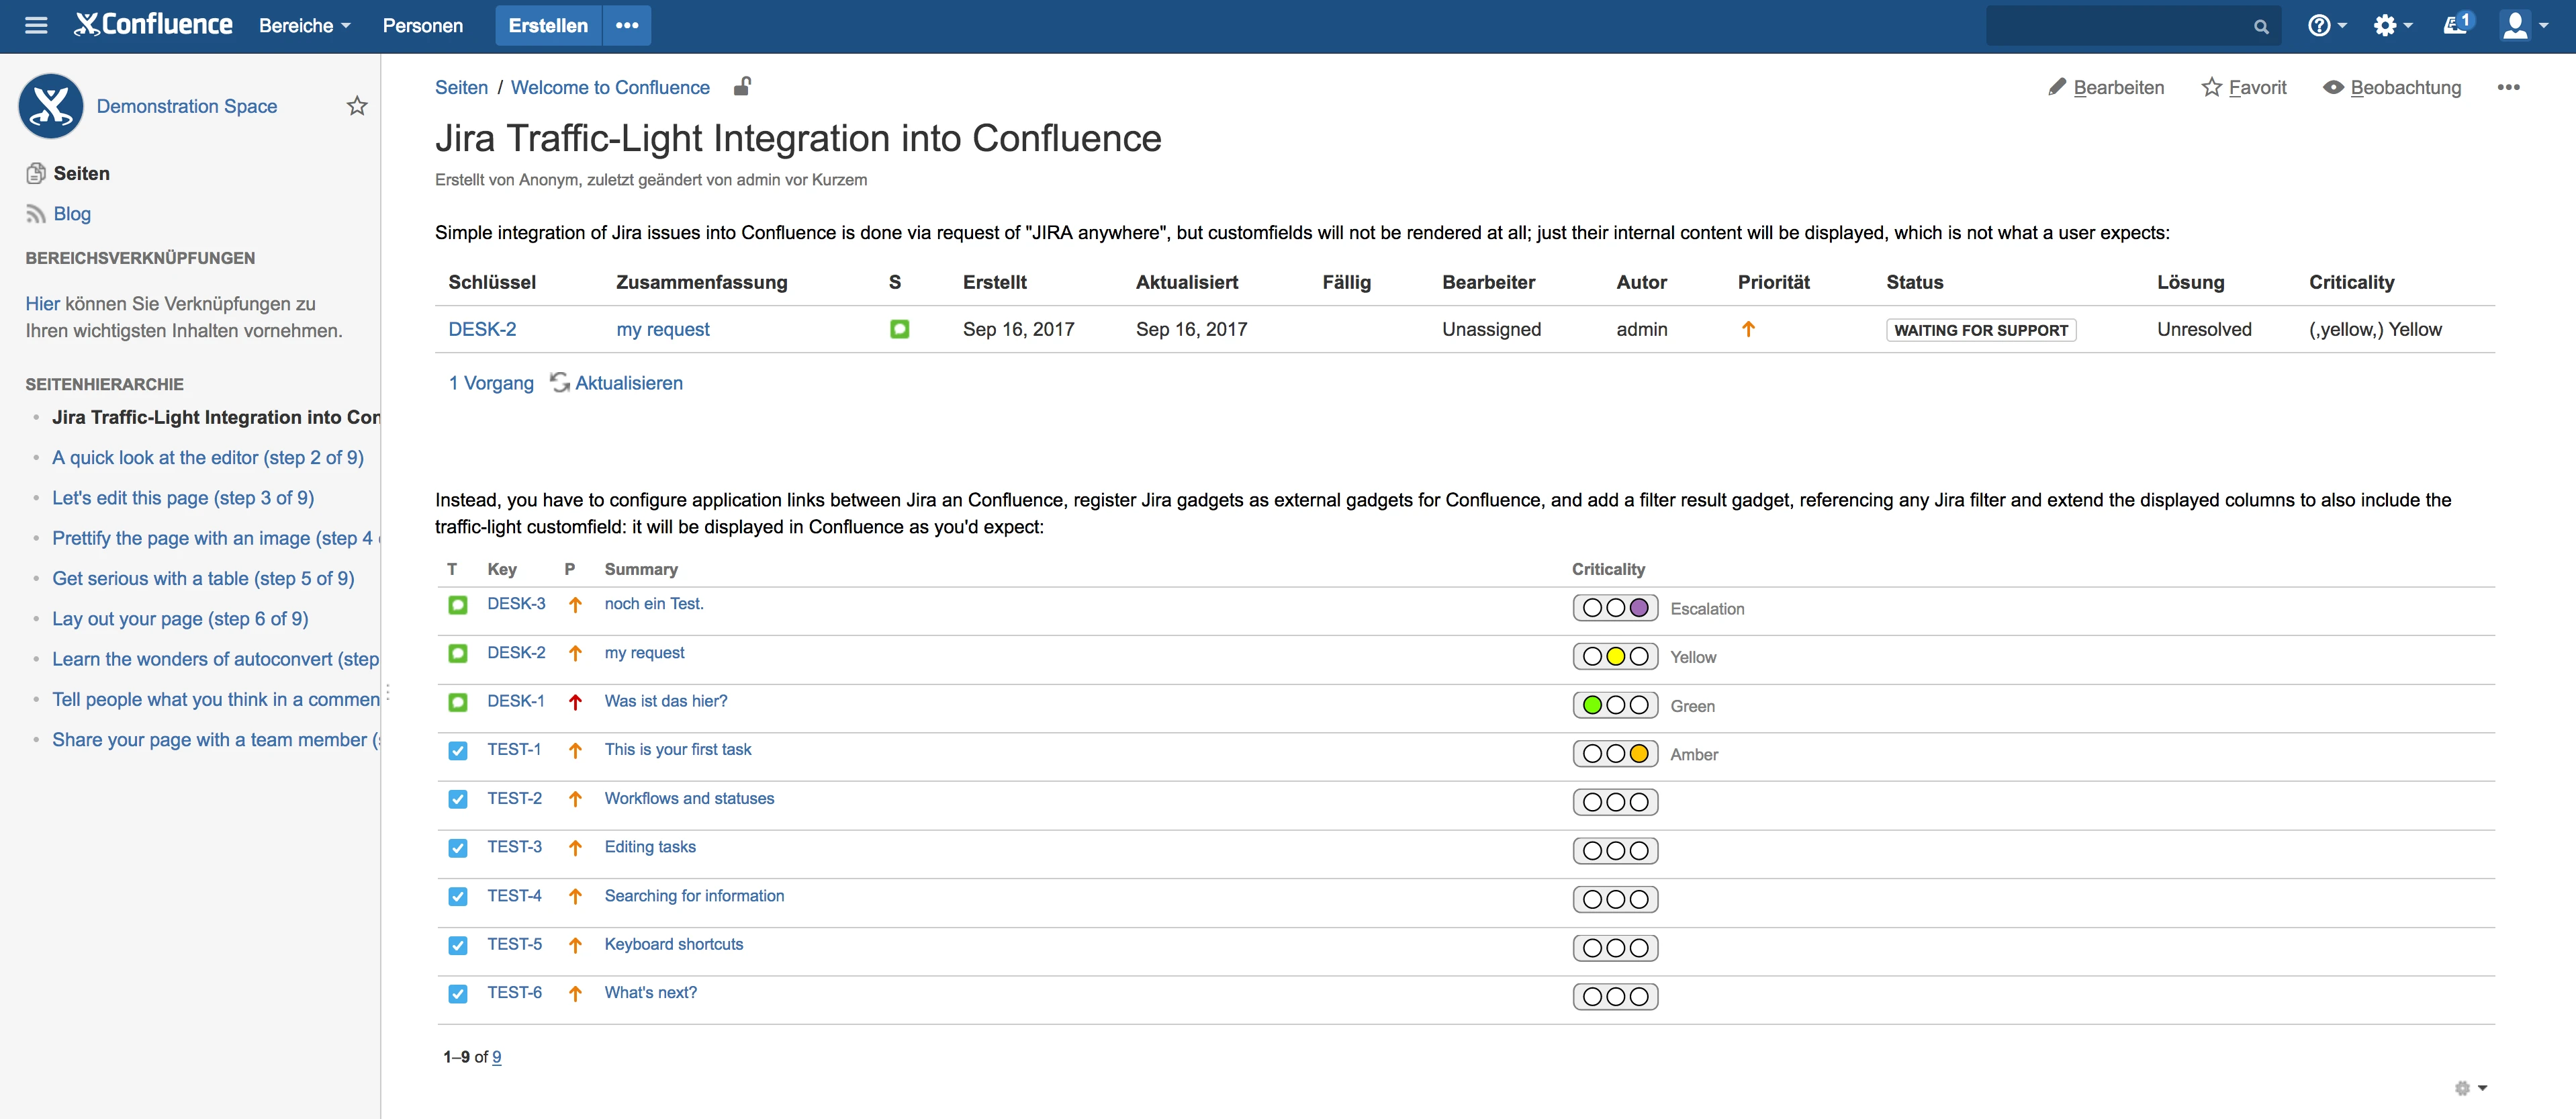
- No Confluence sync. Teams that report status in Confluence must manually copy data from Jira, with no live connection.
These gaps are why organizations with serious RAG reporting needs turn to dedicated tooling.
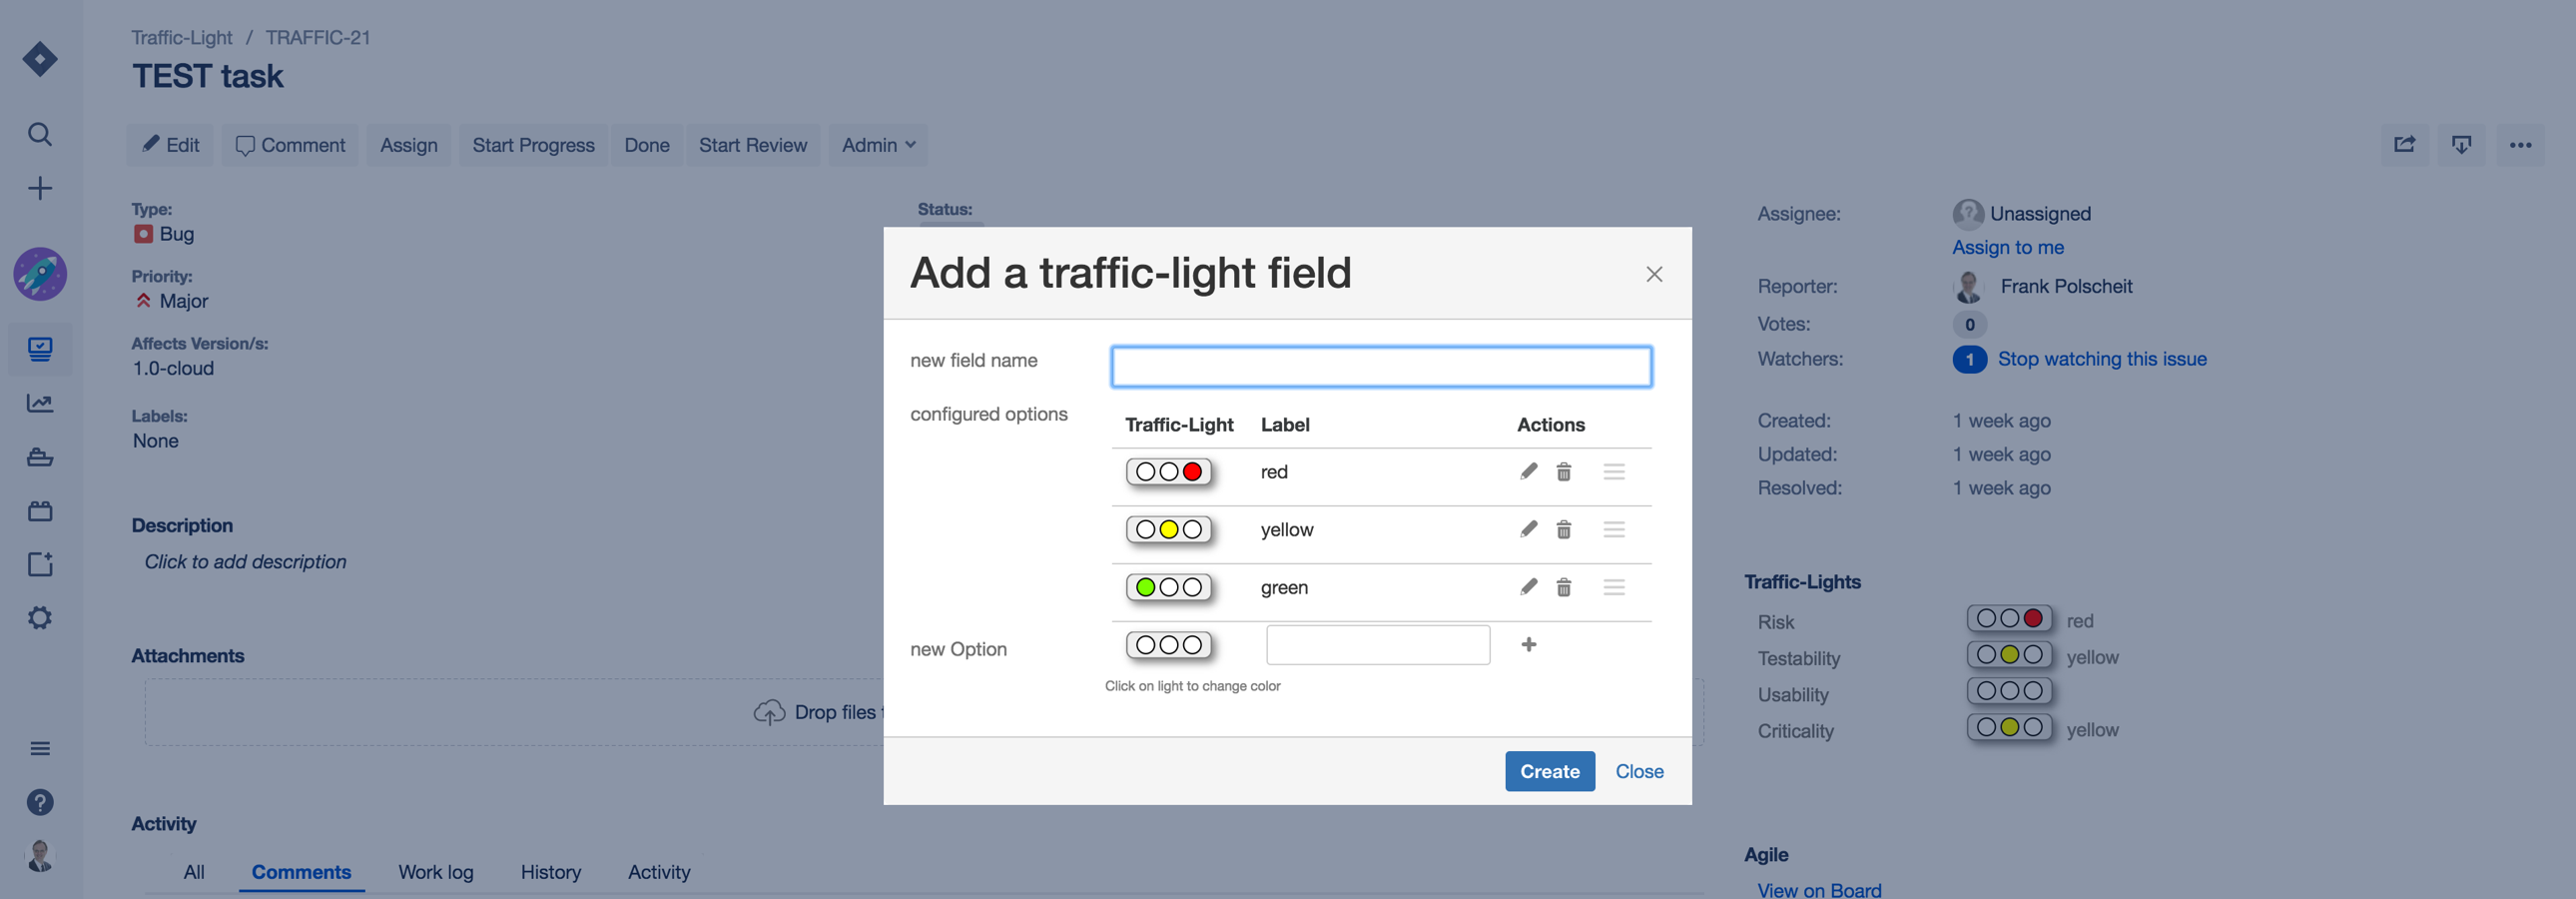
Traffic-Lights for Jira includes ready-made dashboard gadgets for all three levels: issue, project, and portfolio. See how it works.
Implementing RAG in Jira with Traffic-Lights
Traffic-Lights for Jira adds color-coded status fields to any issue type, with dashboard gadgets for portfolio-level views. It eliminates the workarounds described above.
Setting Up Traffic-Lights
- Install from the Atlassian Marketplace
- Add the traffic-light custom field to your issue screens
- Configure default status per project
- Create dashboard gadgets for team and portfolio views
Dashboard Strategy
Create three levels of dashboards:
- Team dashboard. Individual issue status for the team lead.
- Program dashboard. Project-level aggregation for program managers.
- Portfolio dashboard. Cross-project health for executives.
Each level should show both current status and trend. A project that has been amber for three sprints tells a different story than one that just turned amber today.
Real-World Impact: 40+ Teams, 60% Fewer Status Meetings
A global technology company with 40+ engineering teams across 8 countries replaced spreadsheet-based status reporting with Traffic-Lights for Jira. The results after three months:
- Weekly PM status prep time: 3 hours reduced to 20 minutes
- Status meetings per week: 5 reduced to 2 (60% reduction)
- Teams with consistent RAG definitions: ~30% increased to 100%
- Honest reporting increased. Amber stopped being seen as failure, and teams flagged risks earlier.
Better tooling changed behavior, not just efficiency. When updating status is fast and visual, people do it. When it requires a spreadsheet export and a slide deck, they avoid it.
Results were measured after three months of adoption across all teams.
Beyond Manual Updates: Automation and Signals
The most mature teams combine manual RAG assessment with automated signals from Jira data. A project manager's judgment is still valuable: they know about a key person's upcoming leave or a vendor delay that no metric can capture. Automated signals catch the things humans miss or are reluctant to report.
Useful automation signals include:
- Sprint velocity trends. A sustained drop in velocity over two or more sprints can automatically flag a project for review.
- Blocker age. Issues marked as blockers that remain unresolved beyond a threshold (e.g., 3 days) can trigger an amber signal.
- Timeline adherence. Comparing planned vs. actual completion rates at the epic level.
- Dependency health. If a dependency is at risk, downstream projects should reflect that. Learn more about managing dependencies.
Automated signals make human judgment easier. A signal says "look at this." The project manager decides whether it warrants a status change.
Key Takeaways
- Define before you deploy. Written RAG definitions shared across all teams are the foundation. Without them, your dashboard is a patchwork of subjective opinions.
- Reward amber. Status inflation dies when leadership treats amber as a healthy early warning, not a failure signal.
- Update at the right cadence. Weekly for projects, daily for red items, real-time aggregation for portfolio views.
- Automate the signals, not the judgment. Use Jira data to flag potential issues, but let humans make the final call.
- Invest in tooling that removes friction. The easier it is to update and view RAG status, the more consistently teams will do it.
- Measure the meta-metrics. Track how often status is updated, how long items stay amber before resolving, and whether red items get faster response times over time.
Ready to bring RAG status reporting into Jira without the spreadsheet workarounds? Traffic-Lights for Jira is the only RAG status app built on Atlassian Forge, so your data stays in Atlassian's infrastructure with no external data transfer. It carries the "Runs on Atlassian" badge, Atlassian's highest trust designation for cloud apps. Start your free trial today.